Event Aggregation and Anomaly Detection with Spark Streaming, AWS Managed Kafka and Athena
This explores a hypothetical use-case where electricity usage is monitored in real-time with an intent to reduce consumption to help meet both cost reduction and sustainability goals. Streaming usage data is aggregated into hourly average consumption for Analysts use. Additionally real-time alerts are generated whenever a electricity usage anomaly is detected (i.e. a deviation from previous exected usage values).
GitHub repository for project files can be found here.
Use-Case Data
Data for use-case exploration is sourced from Boston Public Library in Copley Square and made available via Analyze Boston.
Data is structured in a tabular format with 3 columns:
- usage_datetime_start_eastern_time - provides start of monitoring window
- usage_datetime_end_eastern_time - provides end of monitoring window
- usage_kw - measured kilowatt usage during monitoring window.
Note: Data is provided daily, with a temporal granularity of every 5 minutes. In order to support a streaming data use-case we will “play back” data via a Streaming Producer to simulate a truely streaming data source.
Use-Case Technical Overview
This use-case is supported via the following infrastrutcure:
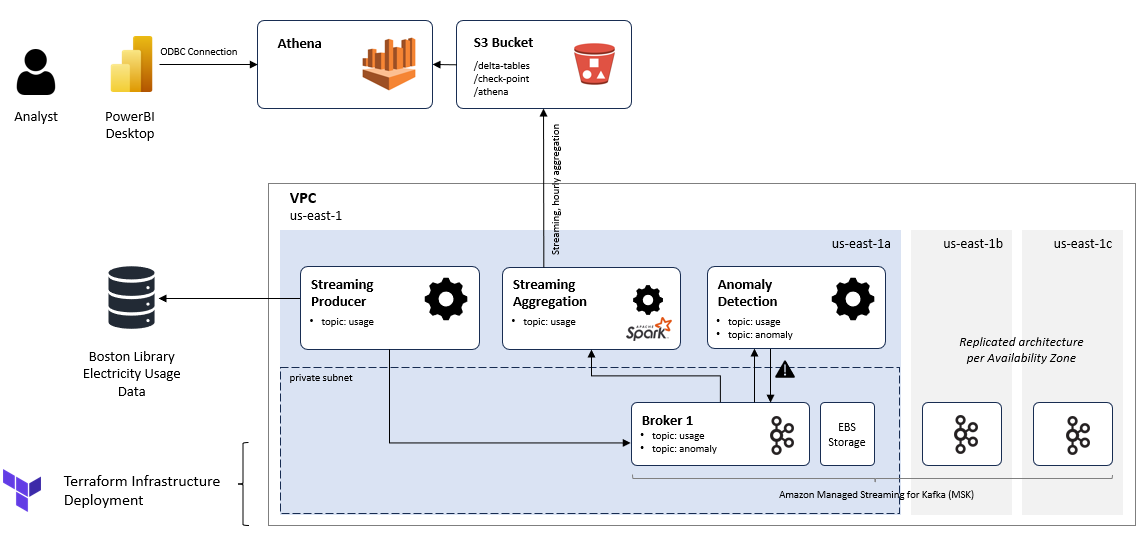
Main architecture systems and technologies discussed include:
- Amazon Managed Streaming for Kafka to provide provisioned Kafka infrastructure and brokers for streaming data processing.
- Terraform for infrastructure deployment automation.
- Spark Streaming for streaming analytics and aggregation.
- Delta Lake format for data table persistence.
- AWS Athena to provide a query engine backed by Delta and S3.
- PowerBI Desktop to provide a Dashboard interface for reporting.
- Sci-kit Learn to provide ML packages for anamoly detection.
Electricity usage monitoring events are generated via the Streaming Producer and published to the Kafka usage topic. From there, a Spark Streaming Consumer aggregates hourly average reported usage and writes to S3-backed Delta Lake file via upserts. PowerBI connects to Athena to execute queries against the Delta tables and provide interactive analytics to a Business Analyst. Additionally a polling Consumer processes real-time events and compares to values from previous same day/hour/minute periods. If anamolies are identified (via Isolation Forest ML) an additional event is published to Kafka anomaly topic for potential down-stream processing.
Infrastructure Setup
S3 Bucket creation
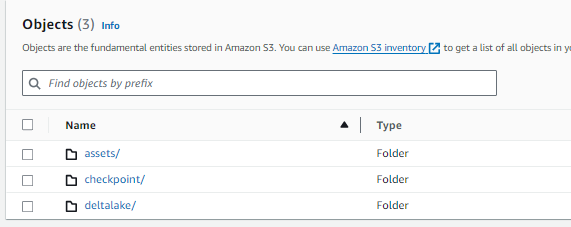
To establish location for assets (e.g. code) and data persistence we will create a S3 bucket with the following folders:
- assets/ - contains code/files that will be downloaded and executed by EC2 producer and consumer instances
- deltalake/ - will contain the deltalake formatted datatables from streaming aggregation consumer
- checkpoint/ - will contain checkpoints from Spark Streaming writeStream
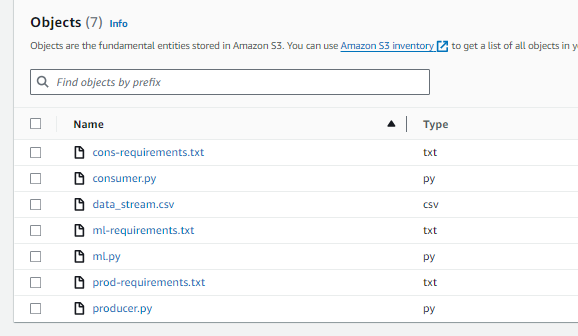
Within the assets folder you should include the following files for EC2 instance use:
- data_stream.csv - data from Boston Analyze representing usage monitoring stream.
- producer.py & prod-requirements.txt - provides Python code for streaming Producer and pip install requirements.
- consumer.py & cons-requirements.txt - provides Python code for Spark Streaming aggregation Consumer and pip install requirements.
- ml.py & ml-requirements.txt - provides Python code for Sci-kit learn anomaly detection Consumer polling implementation.
Note: Asset file names can be changed but would require respective updates to EC2 Terraform templates. For instance you can see line in producer.tftpl ‘hard-coded’ reference to producer.py:
aws s3 cp s3://cscie192-final/assets/producer.py ./producer.py
Future updates could consider automating creation of S3 bucket and upload of asset files via Terraform.
Deploying Kafka (MKS) Infrastructure with Terraform
In a previous article we have looked at running Kafka in a local Docker container. For this exploration we would like to use various AWS services and so will deploy into a Managed AWS environment (MSK).
Given complexity of infrastruture deployment we should automate via Terraform. This article provides a solid foundation for MSK terraform deployment and outlines default configuration options selected in cluster deployment. Minor changes specific for use-case can be found in GitHub repository here. Changes included:
- Adding AWS t2.small EC2 “Producer” Ubuntu instance in public subnet (template)
- Adding AWS t2.small EC2 “Consumer” Ubuntu instance in public subnet (template)
- Update AWS MKS Cluster instance_type to “kafka.t3.small” vs. “kafka.m5.large” to reduce dev costs
- Update AWS MKS Cluster EBS to 100G instead of 1Tb to reduce dev costs
- Update outputs.tf to include consumer and produce SSH connect strings
- Updated variables.tf to use
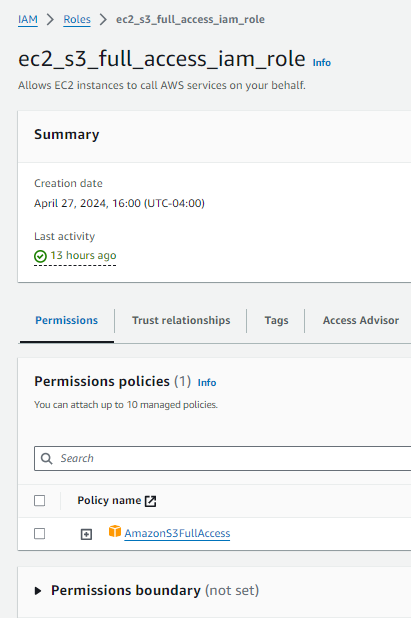
us-east-1and project-specific global-prefix. - Creation of role
ec2_s3_full_access_iam_roleto enable S3 bucket access that is applied to EC2 instances viaiam_instance_profileparameter.
Instructions on installation of WSL and Terraform can be found here. Given AWS cloud deployment you will also need to install AWSCli (sudo apt install awscli) and configure with an account that has IAM permissions for resource creation.
IAM Policies
Below provides list of policies that will likely be convient for tutorial completion:
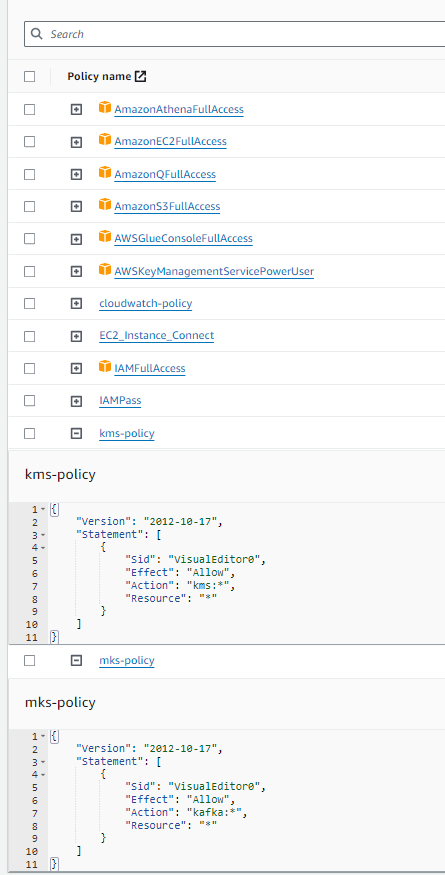
Additional IAM role for EC2 access to S3 buckets:
Warning: Permissions are not fine-tuned for security and should not be considered recommendation for a production deployment.
Once installation and configuration is completed, infrastructure can be deployed via below with total deployment taking 20 to 50 minutes:
> terraform init
> terraform apply
FYI: Infrastruture can be torn down via terraform destroy.
Once deployment is complete you should be able to connect to bastion, consumer and producer EC2 instances via SSH:
> sudo ssh -i cert.pem [ubuntu|ec2-user]@[aws_public_ip]
FYI: sudo command is used to circumvent permissions issues on cert.pem. User (ubuntu or ec2-user) varies depending on the Instance type (linux AMI or Ubnuntu) used. Producer and Consumer Instances are Ubuntu based so use the ubuntu user. Public IPs can be viewed in EC2 Instance dashboard in AWS.
Streaming Producer
Our Streaming Producer (code) is responsible for “playing back” of the downloaded electric usage data to simulate a real-time stream. Essentially, the Producer reads the data and publishes the next set of data as if it was being published at that point in time. Producer can be configured to choose starting point for data publication (i.e. start playback on particular date) as well as accelerator factors (e.g. 10x) to increase speed of playback (turn minute gaps into seconds) to help with simulation testing. Producer development examples sourced from here and kafka-client documentation.
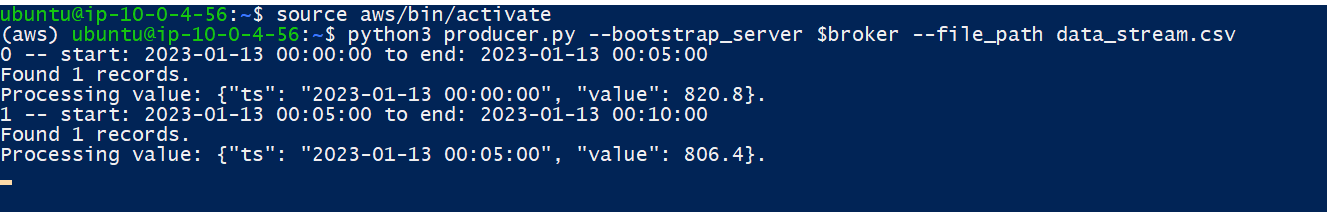
Producer can be launched via:
> source aws/bin/activate
> python producer.py --bootstrap_server $broker --file_path data_stream.csv
FYI: $broker is set as environmental variable during EC2 instance creation.
Additional command line options include:
- step_frequency - to set the polling frequency (defaults to 5, inline with electricity usage periodicity)
- accelerator - adds a multiplication factor to “speed up” playback increasing the range of records for each pull by provided factor.
FYI: Other options like playback start date or max number of event iterations can be set directly within the code.
Once launched, console will output events being published (indefinitely until interrupted):
Streaming Aggregation Consumer
Our Streaming Aggregation Consumer (code) is responsible for streaming kafka events into S3 as delta-lake formmatted tables. This aggregator will average out usage values within a 1 hour window. Consumer developement examples sourced from here.
Streaming aggregation can be launched via:
> source aws/bin/activate
> spark-submit --packages
                    org.apache.spark:spark-hadoop-cloud_2.12:3.5.1,
                    org.apache.spark:spark-sql-kafka-0-10_2.12:3.5.1,
                    io.delta:delta-spark_2.12:3.1.0
                --conf "spark.sql.extensions=io.delta.sql.DeltaSparkSessionExtension"
                --conf "spark.sql.catalog.spark_catalog=org.apache.spark.sql.delta.catalog.DeltaCatalog"
                consumer.py --boostrap_server $broker --s3_bucket [bucket_name]
Watch-out: Command should be executed as one line without spaces between packages. The above is seperated per line for readability. Specific deltalake, s3 support and kafka packages are required for Consumer execution.
Load Kafka Stream
df_kafka_stream = ( spark
                   .readStream
                   .format("kafka")
                   .option("kafka.bootstrap.servers", args.bootstrap_server)
                   .option("subscribe", "usage")
                   .option("startingOffsets", "earliest")
                   .load()
                )
Convert Kafka binary JSON to Structured Dataframe
Provide a schema for processing and “explode” nested JSON values into columns.
# Define JSON Schema:
schema = StructType([
    StructField("ts", TimestampType(), True),
    StructField("value" , FloatType(), True),
    ])

# Convert Kafka JSON to structured columns:
df_json_stream = ( df_kafka_stream
                  .select(
                      from_json(
                          col("Value").cast("String"),
                          schema).alias("json_value")
                      )
                  ).select(col("json_value.*"))
Create Aggregation Window
Specify aggregation window of 1 hour. Additionally set a watermark time-out of 1 hour to prevent inclusion of delayed messages.
# Aggregate streaming values:
df_window_stream = ( df_json_stream
                    .withWatermark("ts", "1 hour")
                    .groupBy(
                        window("ts", "1 hour")
                    ).agg(avg("value").alias("avg_usage"))
                    ).select("window.start", "window.end", "avg_usage")
Write to Delta Lake format
Establish an upsert strategy based on usage start_date column. If new messages arrive with same start date overwrite old, or add as new row. Write out structured data to S3 in deltalake format.
# Create Dataframe w/ window_stream schema
(spark
 .createDataFrame([], df_window_stream.schema)
 .write
 .option("mergeSchema", "true")
 .format("delta")
 .mode("append")
 .save(delta_location))

# Set upsert criteria
def upsertToDelta(df, batch_id):
  (DeltaTable
   .forPath(spark, delta_location)
   .alias("t")
   .merge(df.alias("s"), "s.start = t.start")
   .whenMatchedUpdateAll()
   .whenNotMatchedInsertAll()
   .execute())

# Write to S3 as Delta
w = (df_window_stream
 .writeStream
 .format("delta")
 .option("checkpointLocation", checkpoint_location)
 .foreachBatch(upsertToDelta)
 .outputMode("update")
 .start(delta_location))
Athena Query Engine
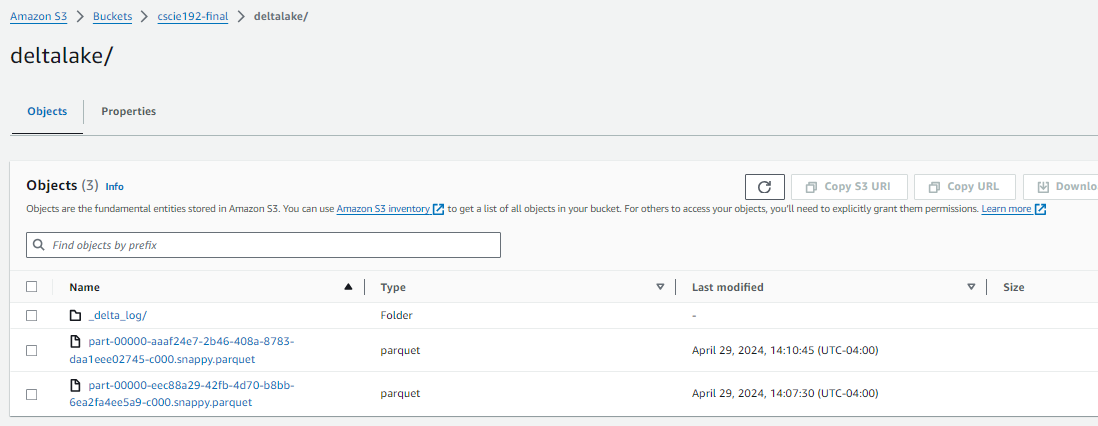
After launch, you should start to see parquet files created in the deltalake S3 location indicating that data is starting to stream into tables:
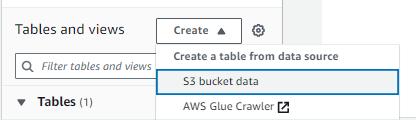
You can additionally add the S3 location as a table datasource in Athena to enable querying of newly created Delta tables:
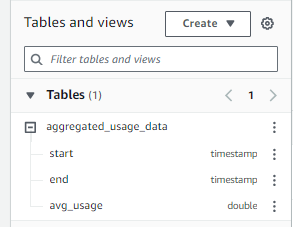
Query the deltalake tables with SQL:
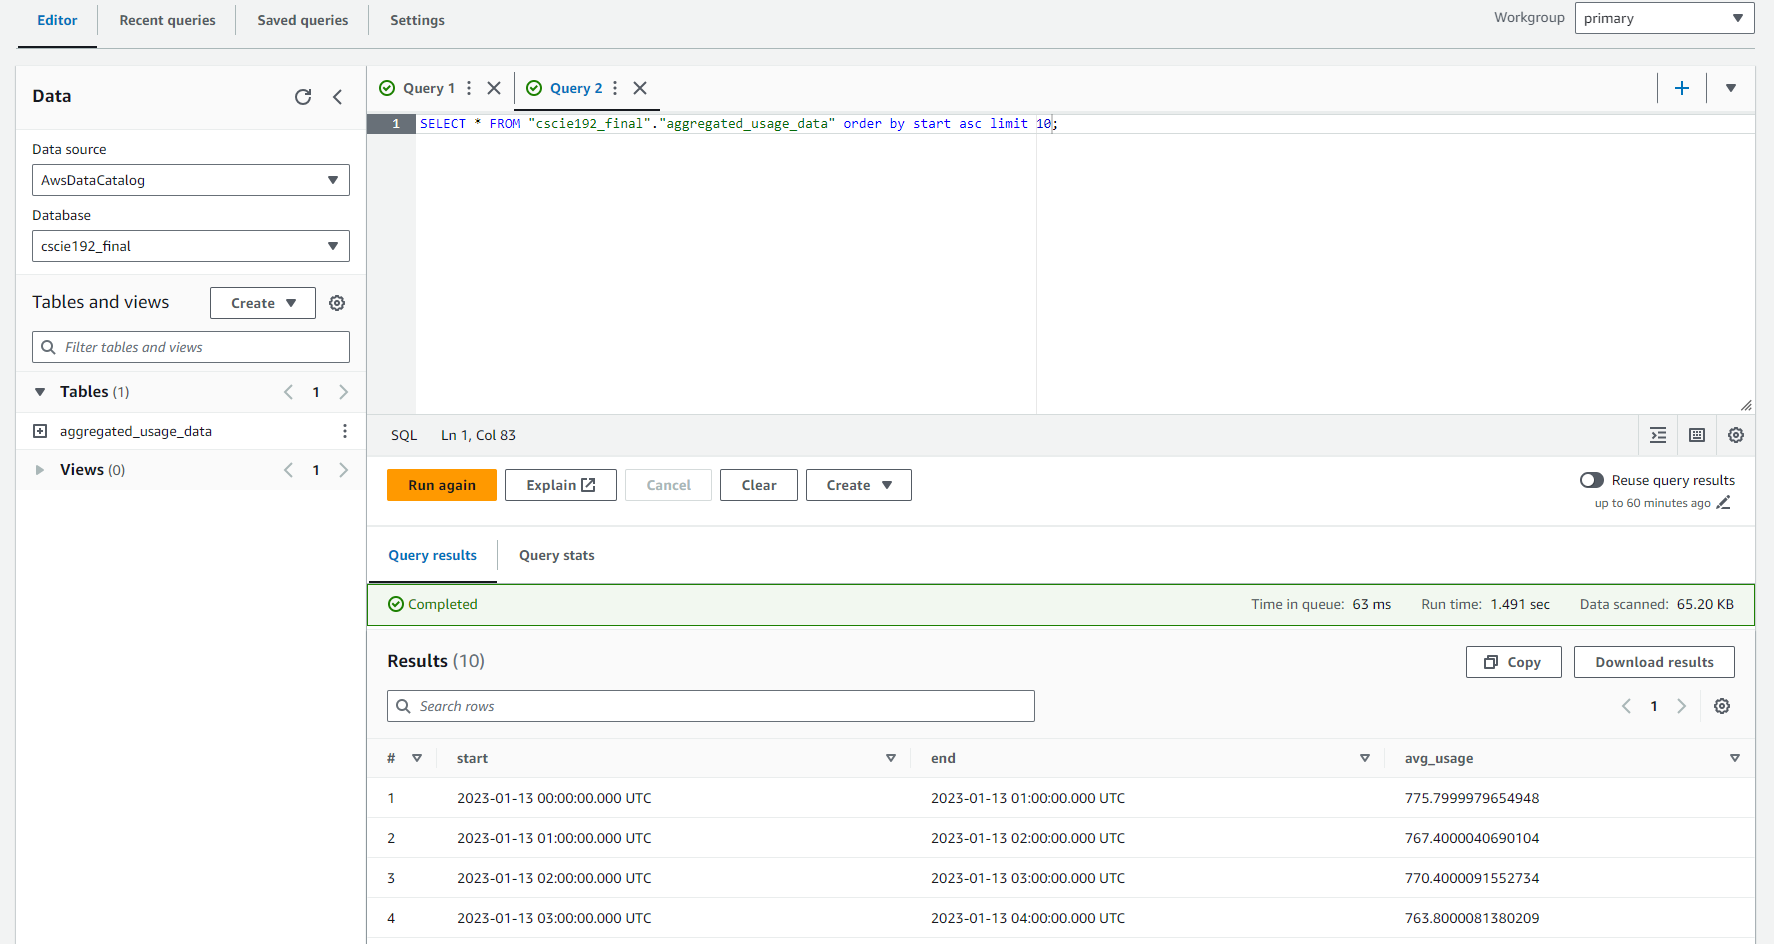
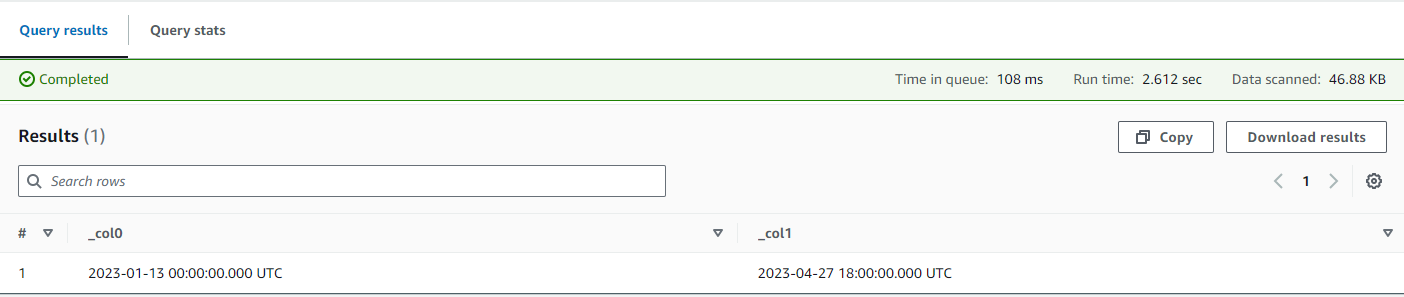
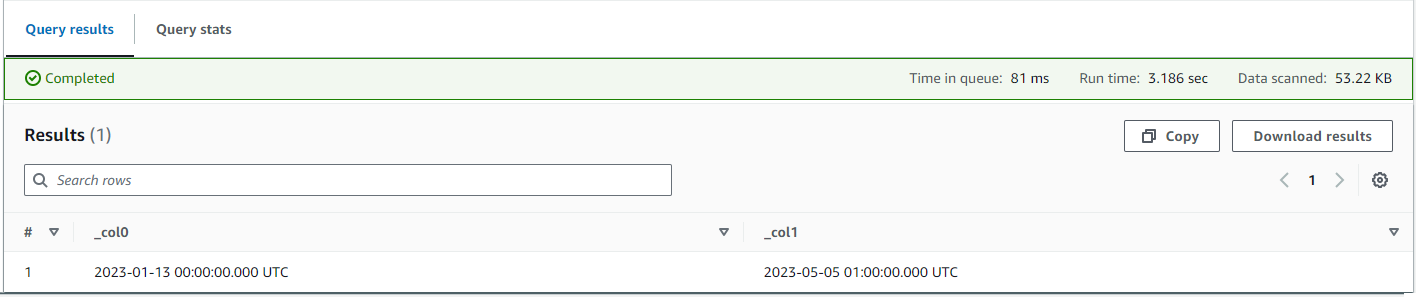
Multiple executions of the query will show data changes as the Streaming Aggregator continues to process messages:
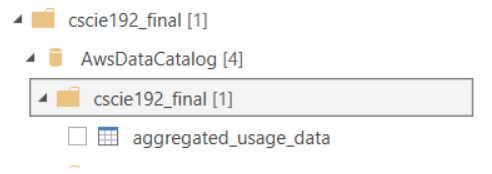
PowerBI Desktop Interface
PowerBI Desktop can be connected to Athena via ODBC drivers with instructions listed here.
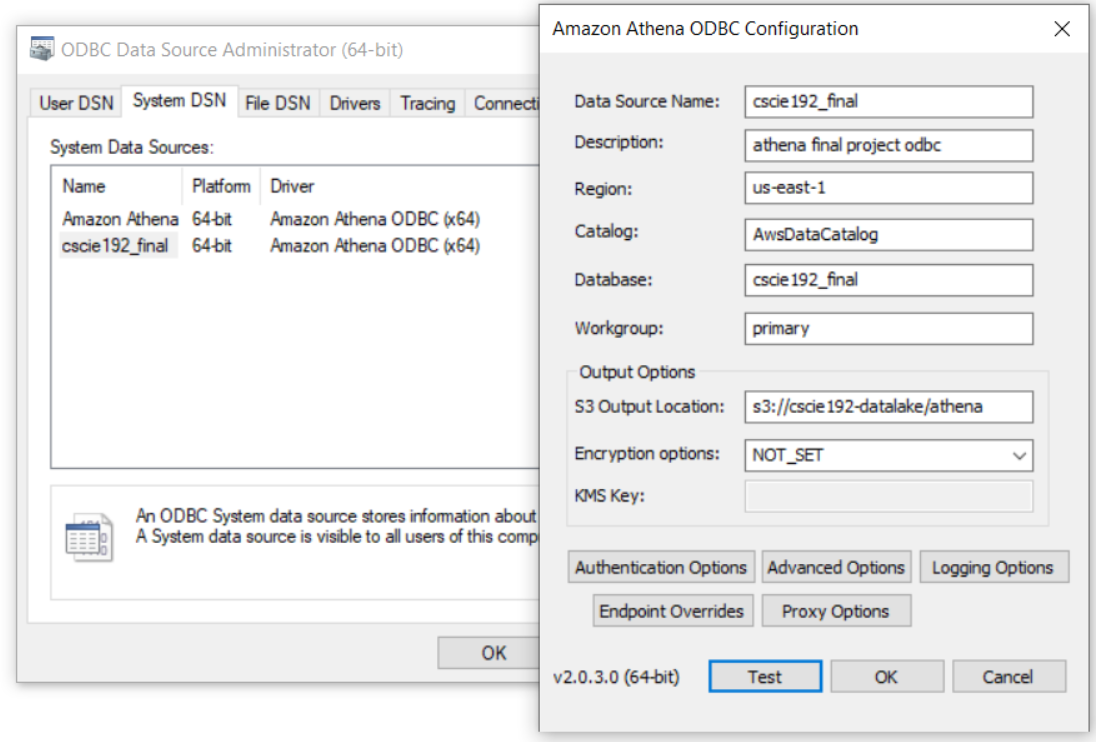
This will allow us to import (or direct query) Athena tables into PowerBI.
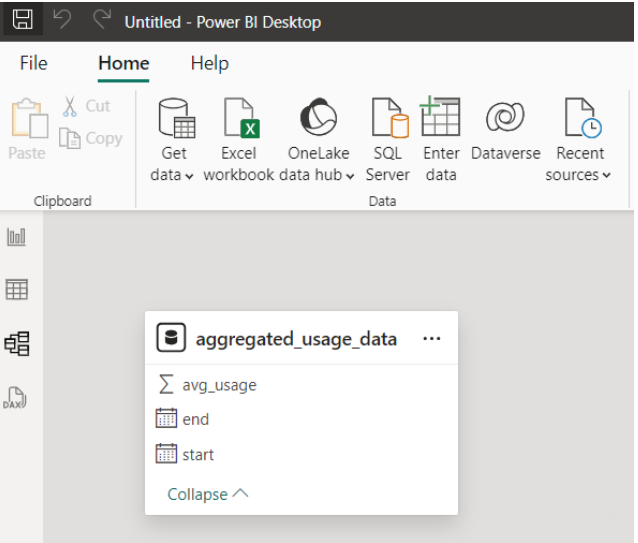
For example graphing of the average hourly electricity usage for consecutive days illustrated below:
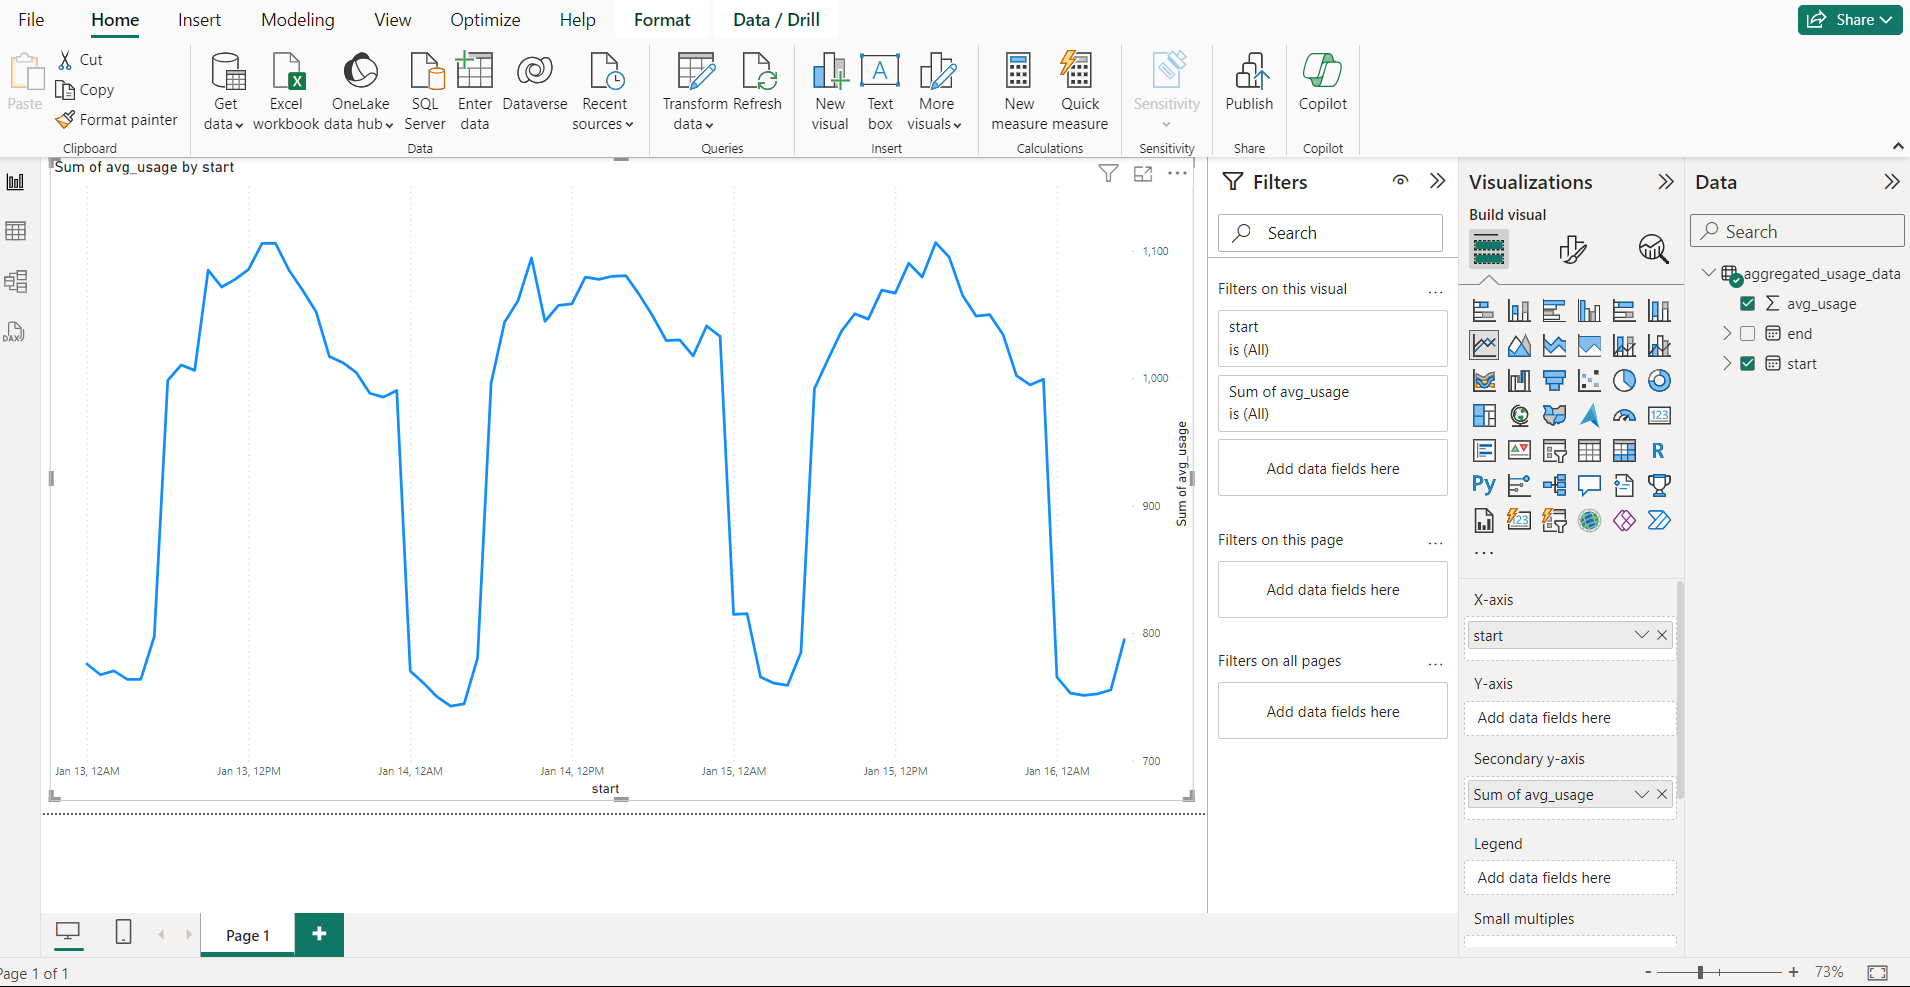
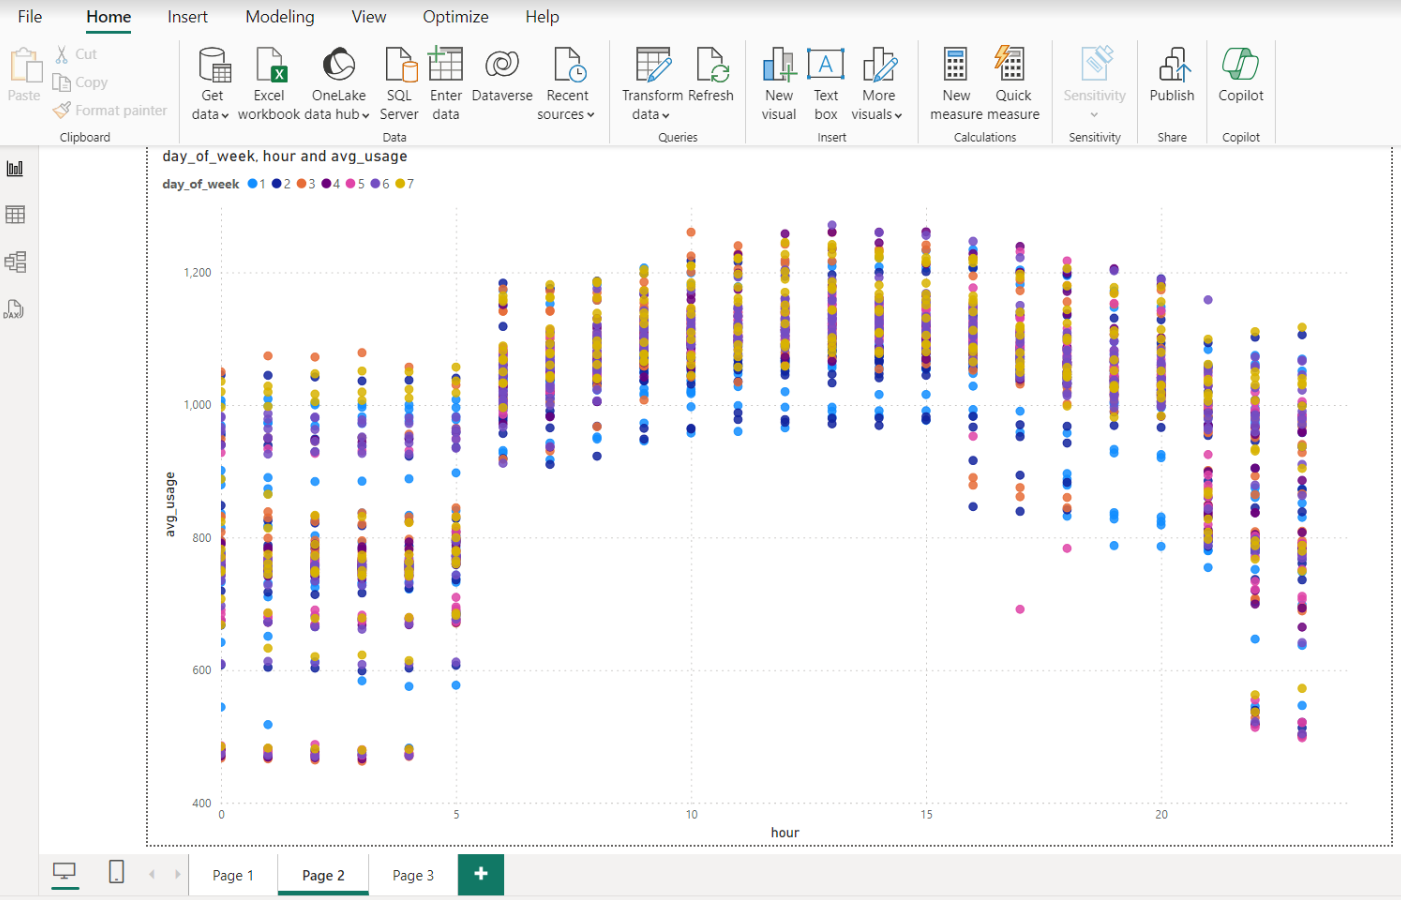
Note: Other methods of visualizing data based on Athena are also possible - including AWS QuickSights as well as AWS managed Grafana. These methods were explored and rejected for either cost reasons (i.e. QuickInsights monthly fee) or issues with managing permissions (i.e. Grafana execution was blocked by permission issue conflicts between IAM and IAM Management Center setup).
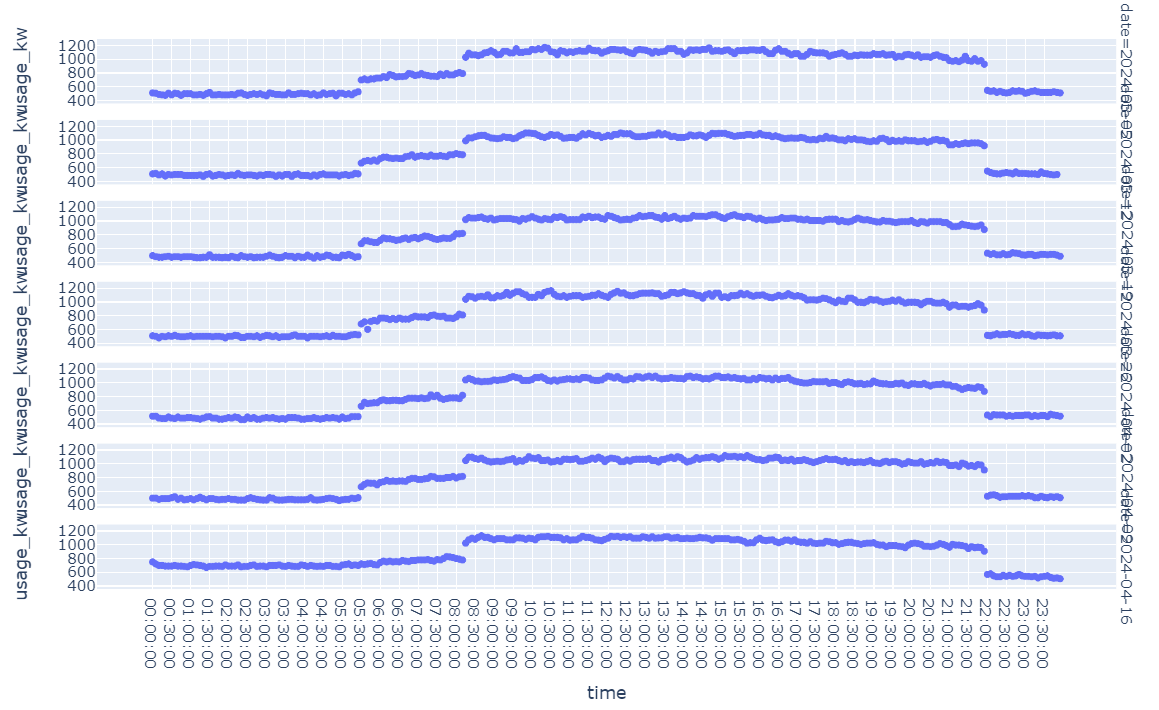
Anomaly Detection
Our Anomaly Detection Consumer (code) is responsible for identifying outlier usage values and creating an associated message in the Kafka anomaly topic for downstream alerting.
An exploration of data trends can be found in ML EDA Notebook highlighting generally consistent trends with trend variation at day of week and hour:min time of day:
As an example, selecting a set of 13 comparable usage values on Mondays at 8:10 AM EST we can see fairly consistent usage and one outlier on Jan 23, 2024:
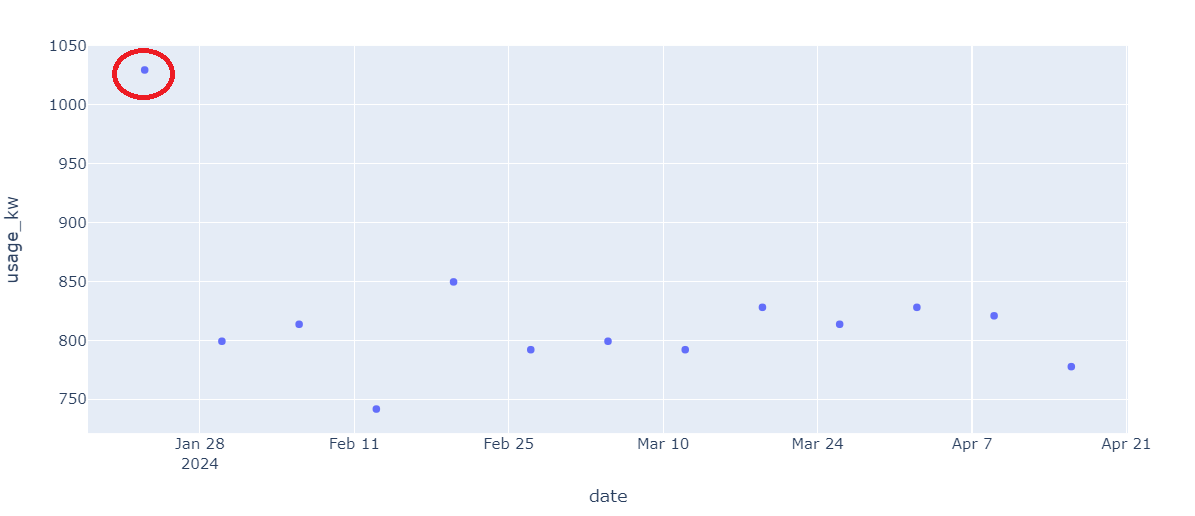
Given the above exploration, it is believed that we can feasibly identify outliers - but that we will likely need to compare points from same day, hour and minute to gain quality peer comparison points. Anamoly detection will need to be unsupervised (i.e. not using a pre-labeled data-set), flexible and have low fit and inference execution time.
Based on articles here, here, here, here and here it was decided to use an unsupervised anamoly detection approach of Isolation Forests from the sci-kit learn package. Given the by day-hour-min variation, seperate Isolation Forests will be built at this level.
Note: Experimentation was also done with seasonal/ARIMA forecast approaches (e.g. Prophet) but found not as accurate. Additionally a simpler Isolation Forest fitted at the day level was also experimented with but was unable to capture variance by minute (as categorical or regressive variable).
Implementation
A Consumer polling loop is implemented to process newly created events in the usage topic. We will store a history of points that will be used for anomaly detection. In order to protect against memory overflows, a deque is used with a fixed size limit to maintain last N events:
class FixedEventList:

    def __init__(self, max_size) -> None:
        self._queue = deque( maxlen= max_size )

    def add(self, ev:Event ):
        self._queue.append(ev)
If sufficient comparable points are available (currently set for min of 4) then an Isolation Forest is built on the comparable points and new point is scored using model. If considered an outlier a -1 value is returned as prediction, otherwise 1.
# Build Isolation model from comparable points:
iso_forest.fit( comps[["usage"]] )

# Score new point:
new_item = pd.DataFrame([new_event.toDict()])
prediction = iso_forest.predict( new_item[["usage"]] )

# If prediction is -1 (anamoly) publish to topic:
if prediction[0] == -1:
    print("Publishing anomaly")
    pl = {"ts": msg_json["ts"],"usage" : msg_json["value"]}
    p.produce("anomaly", value=json.dumps(pl))
Launching Detection Consumer
From the Consumer EC2 instance the Anomaly Detector can be launched via:
> source aws/bin/activate
> python3 ml.py --bootstrap_server $broker --max_history 70
Note: For testing purposes you may want to launch Producer with a high accelerator value to speed up history build:
>> python3 producer.py --bootstrap_server $broker --file_path data_stream.csv --accelerator 1000
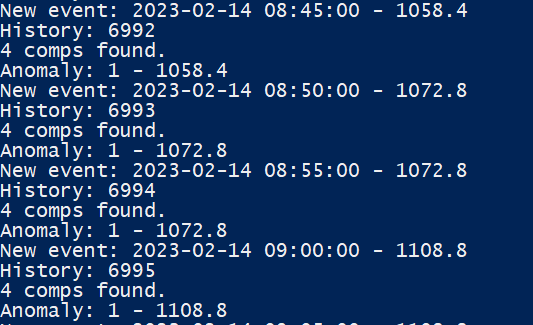
As Detector executes it will output available comparable (comp) points:
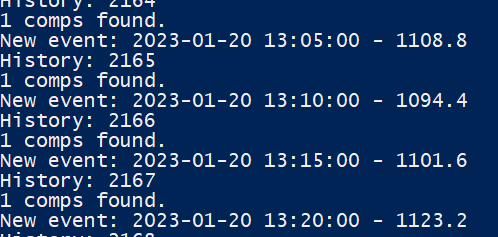
Once reaching more than 4 comparables predictions will start to be executed:
Viewing Anomalies
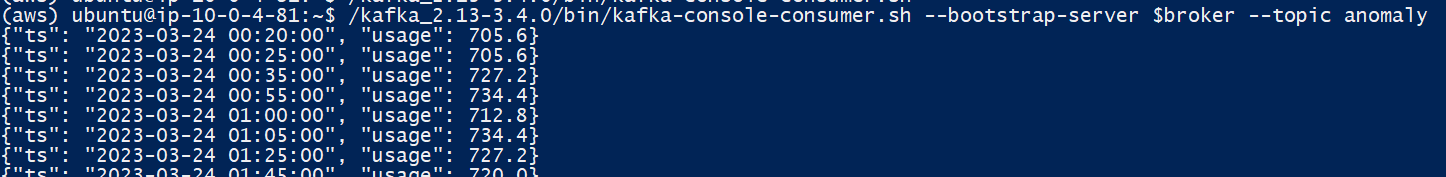
The anomaly topic can be monitored from the Consumer EC2 instance using Kafka utilities:
> /kafka_2.13-3.4.0/bin/kafka-console-consumer.sh --bootstrap-server $broker --topic anomaly
Below shows Producer (left), ML Anomaly Detection (middle), and Consumer output of anomaly topic (right) to illustrate data flow through of full sequence via Kafka topic queues:
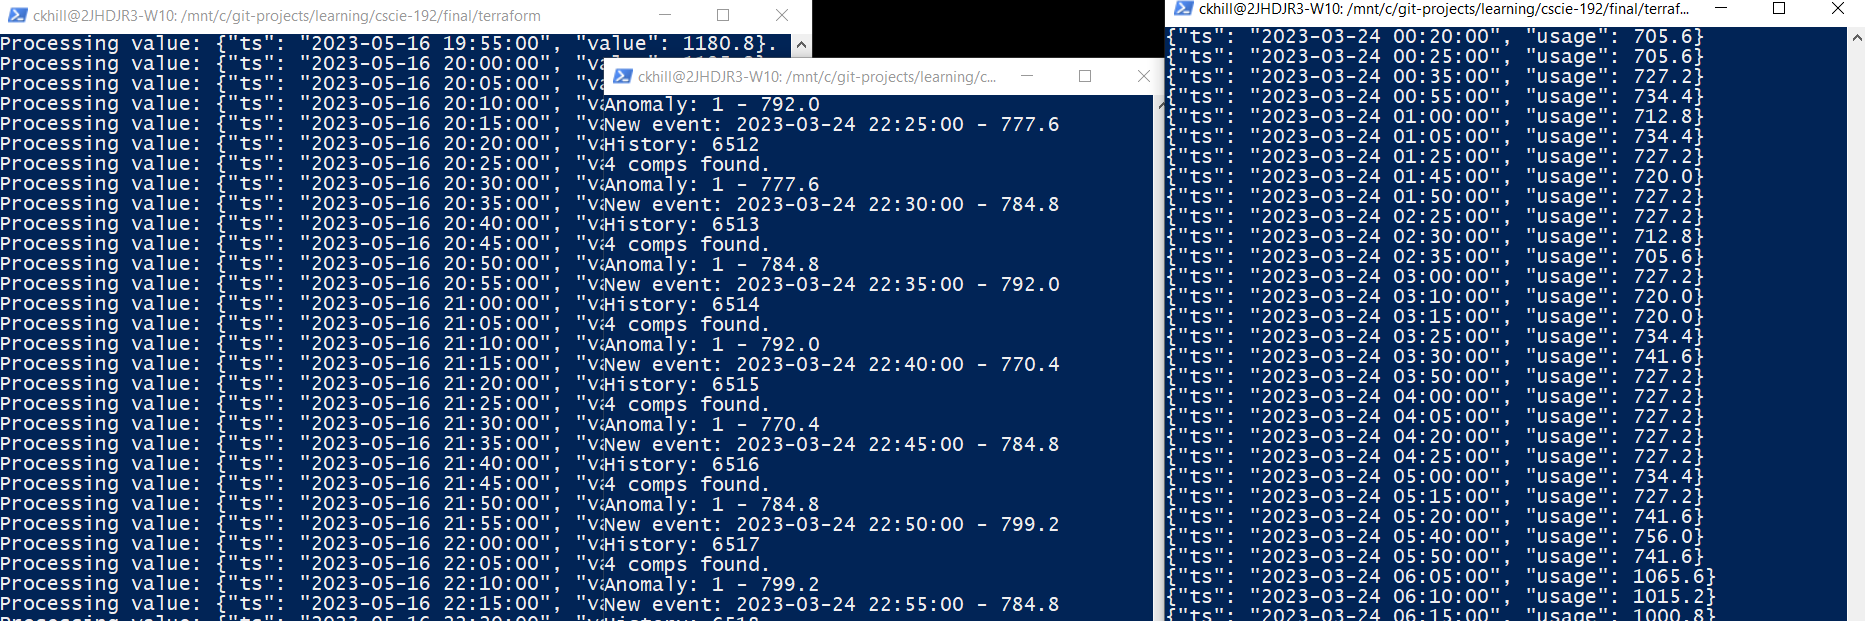
Other Consumers could be implemented to process anomaly events, for example posting to messaging channels or interfacing with high-power consumption IOT devices to prompt immediate manual or automated interventions in electricity consumption.